Query Studio module
Overview
Query Studio is an embedded, lightweight SQL workbench integrated directly into the Gluesync Control Plane. It acts as an in-product alternative to external database management tools (such as DBeaver, DataGrip, or pgAdmin), allowing developers, database administrators, and sync engineers to inspect, query, and validate synchronized datasets without leaving the Gluesync portal.
By leveraging Gluesync’s pre-existing knowledge of source and target database credentials, Query Studio provides a unified, secure workspace where you can run ad-hoc queries, explore schema hierarchies, inspect execution plans, and run statistics directly against your managed connections.
Key capabilities
-
Multi-tab SQL editor: Keep up to 10 active SQL editors open in a single session, with query scripts and tab configurations persisted locally.
-
Dialect-aware syntax highlighting: Highlighting and auto-complete are tailored dynamically to the specific database engine of the selected agent (e.g., PostgreSQL, Oracle, MySQL, SQL Server).
-
Interactive schema browser: A dynamic tree representation of the database’s schema hierarchy that lets you lazy-load schemas, tables, and columns on demand. A table click opens a dialect-quoted one-click browse (
SELECT *); a schema-context New query editor action opens another editor tab. -
Explain plan visualization: Dialect-native
EXPLAINquery analyzer that outputs the physical or logical query execution path in text or hierarchical tree formats. -
Query progress streaming: Real-time progress notifications (started, executing, first row, rows processed) delivered via standard Gluesync WebSocket channels.
-
Secure transaction boundaries: Safeguard production databases using default "Read-only" transaction isolation levels, with toggleable write permissions for authorized administrators.
-
Automatic parameter prompting: Detects and parses positional (
?) or named (:name) query parameters in SQL statements, requesting user input values before execution. -
Query statistics calculation: Computes analytical data statistics (min, max, mean, length, unique values, null count/percentage) on the client side for returned results.
-
Chart result visualization: Build a client-side Bar, Line, or Pie chart from the current result by selecting label and value columns.
-
Flexible result exporting: Download result sets as CSV, XLSX, or JSON, or copy them as CSV, JSON, Markdown, HTML, XML, or a formatted SQL
INSERTscript. -
Value viewer and record view: Inspect a cell in a read-only value viewer, or page through the current result page in record form view.
-
Edit-in-place: In Writable mode, update non-primary-key cells in single-table results whose primary key is available from schema discovery, including Set NULL and Set DEFAULT cell actions.
-
Data import: Import CSV or XLSX data into a selected target table.
-
Manual transactions: Begin, commit, or roll back work on a dedicated session connection when the selected agent supports manual transactions.
-
MCP tools and toolsets workbench: With Dev Mode enabled, switch between SQL-capable agents and MCP-capable agents to run MCP tools and manage custom tools and toolsets.
-
Saved queries & execution history: Store recurring query templates within specific pipeline contexts and track up to 500 query execution records.
UI tour
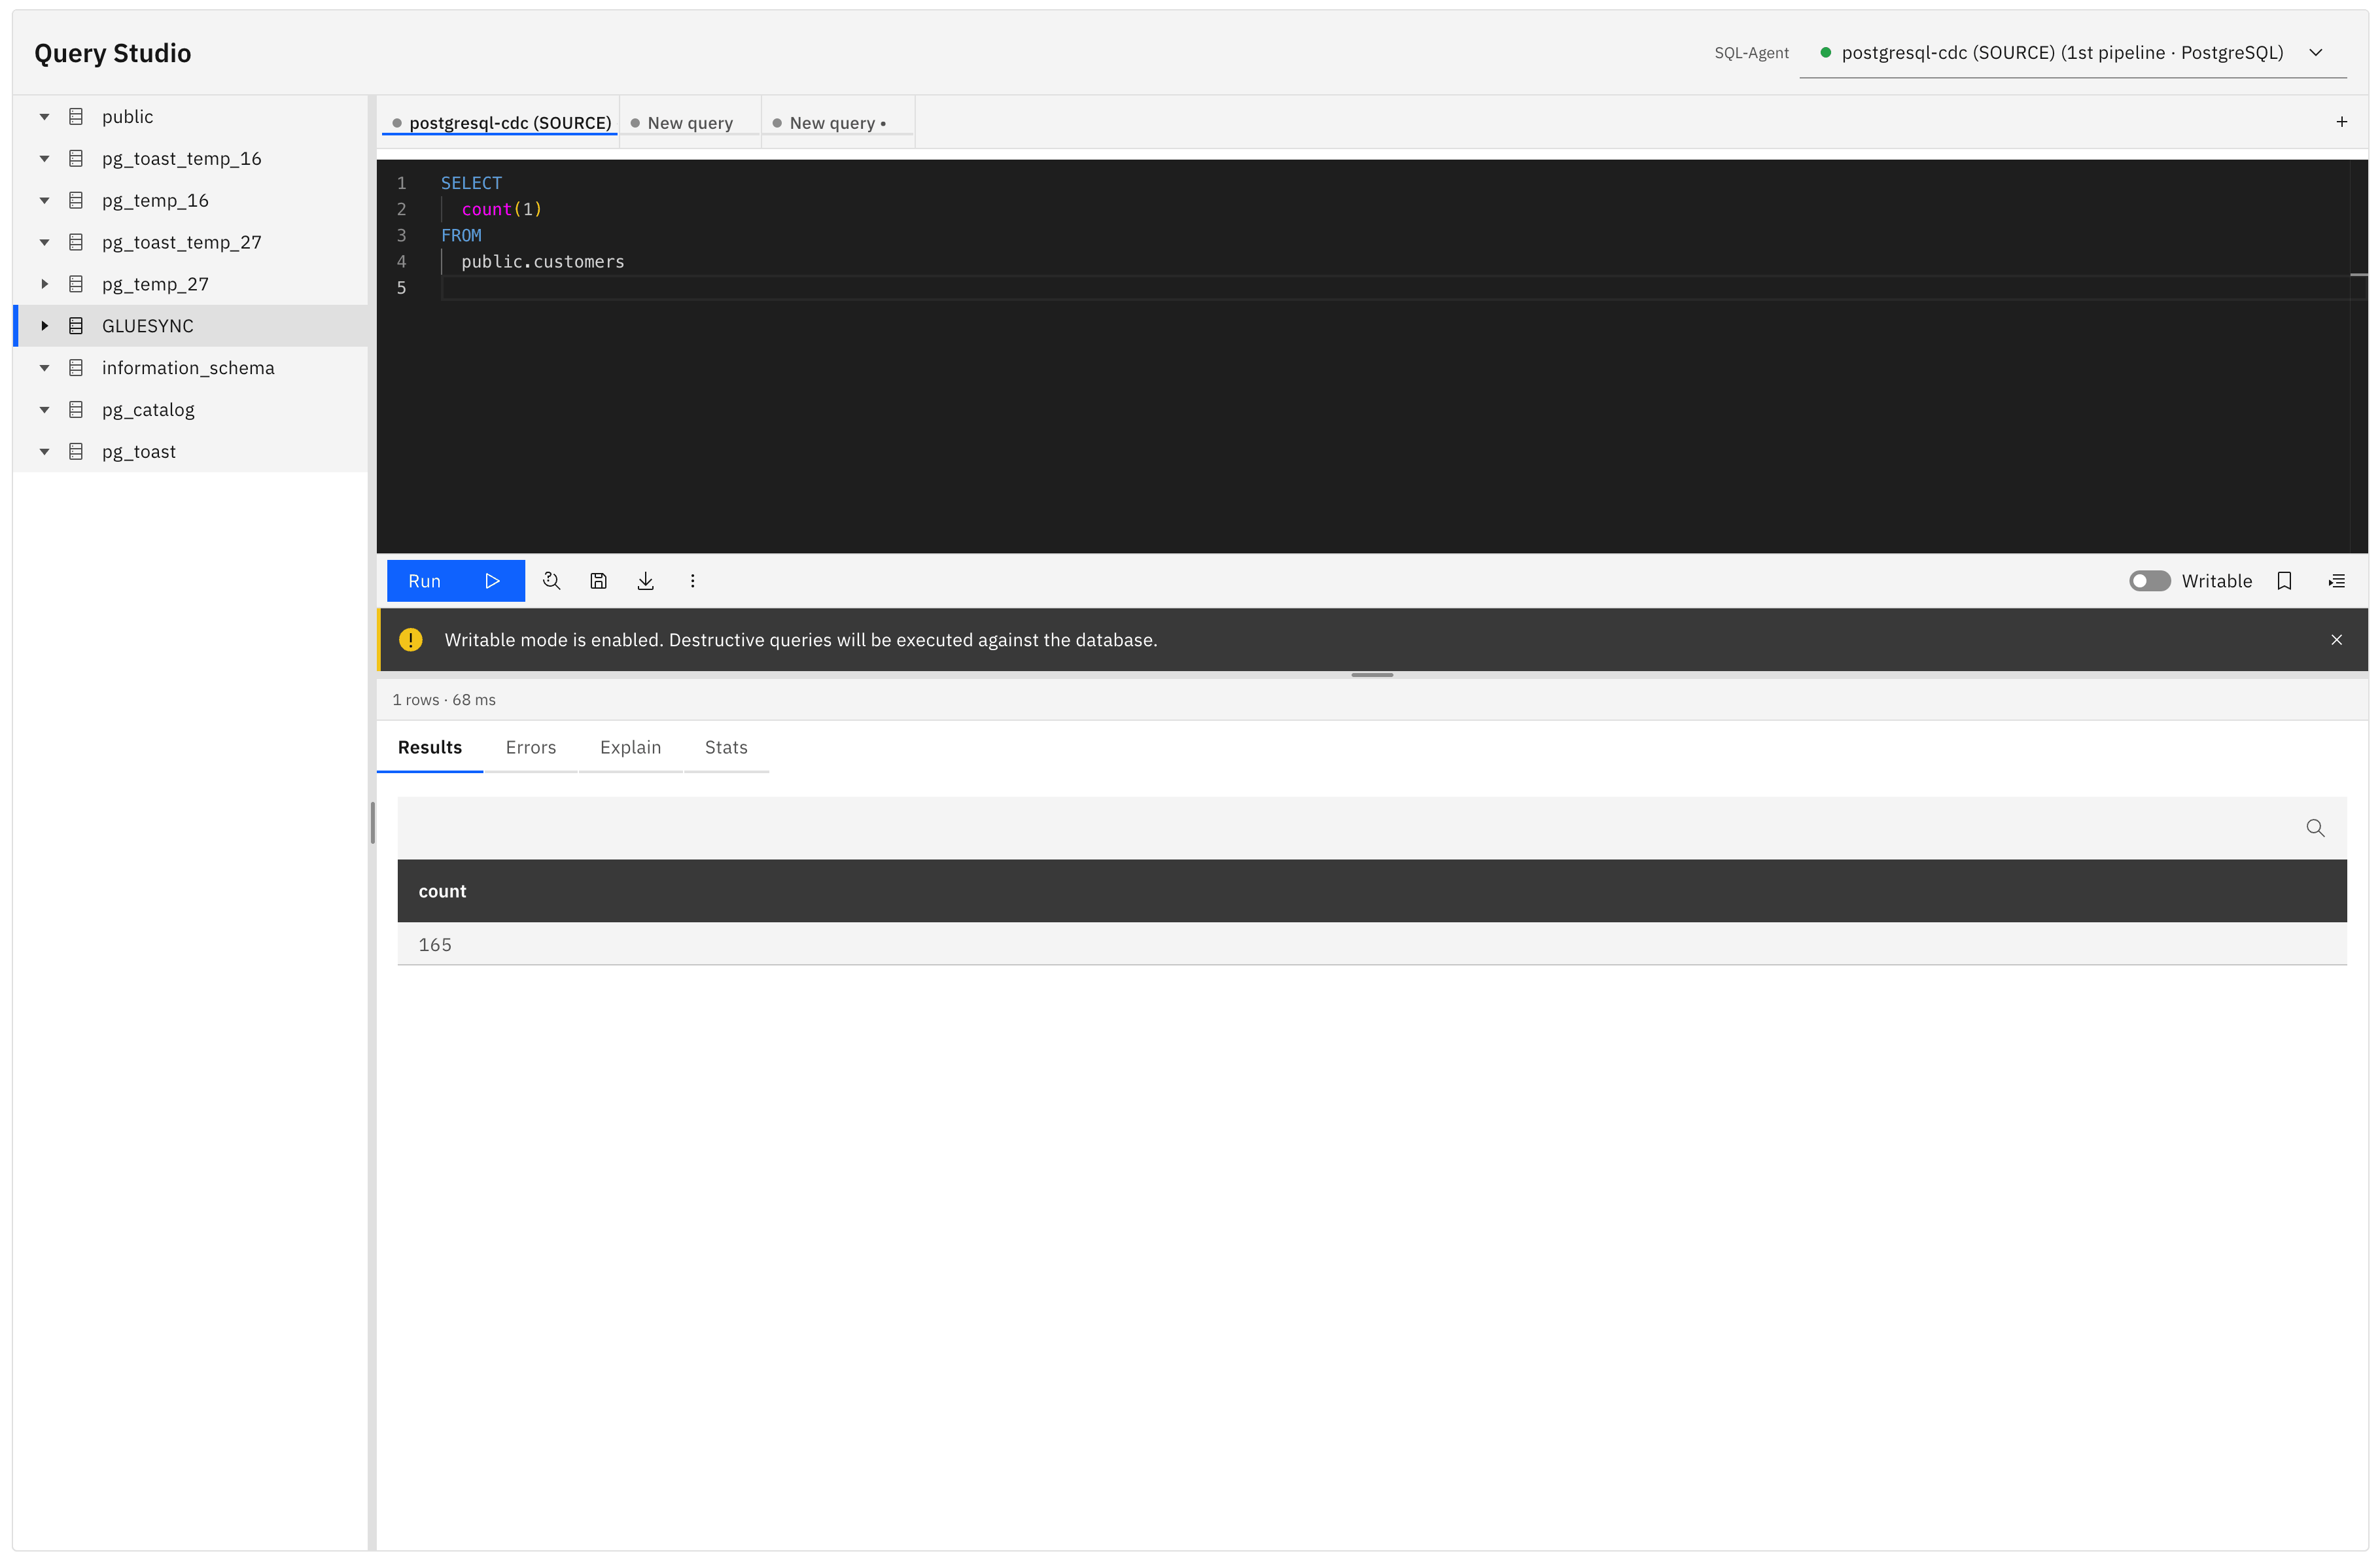
Query Studio is organized into a cohesive three-pane workspace:
-
Connection picker (top bar): Selects the pipeline and agent connection. A dedicated color chip—synced with the pipeline’s metadata color or inferred from environment patterns (Dev, Test, Prod)—provides clear visual context of the active database instance.
-
Schema browser (left panel): Provides hierarchical exploration of the active database connection. You can expand schemas to view tables, and tables to inspect columns along with their data types. Click a table to start a one-click browse; from a schema, New query editor opens another SQL tab.
-
Interactive editor & results (center panel): Contains the multi-tab SQL editor, action toolbar, and result sections. The results pane includes specialized tabs:
-
Results: Interactive data grid displaying query outputs with sortable headers.
-
Errors: Highlights detailed database error messages, warning logs, and line/column error markers.
-
Explain: Visualizes the database-specific execution plan.
-
Stats: Displays client-computed statistics for each returned column.
-
Chart: Builds a client-side Bar, Line, or Pie chart from the current result. Choose a Label column and a Value column; before a query returns data, the tab shows Run a query to see chart data.
-
Session feed: Lists statements run in this Query Studio session (client-side).
-
History: Shows the Query Studio execution history.
-
|
Session feed, one-click browse, browse-filter chips, the value viewer, Record view, Copy as Markdown/HTML/XML, and Set NULL / Set DEFAULT cell actions are 2.2.11.1 Control Plane chrome (UI !538), documented here alongside the matching Hub API contracts. They are not part of released 2.2.11. Chart results, XLSX export, import, edit-in-place basics, MCP tools, and manual transactions are already in 2.2.11. |
Supported database agents
Query Studio is restricted to agents that expose a SQL query interface. To protect platform performance, NoSQL connectors without one (such as MongoDB, Cassandra, Redis, or Aerospike) are automatically filtered out from the connection picker.
|
Couchbase is available in Query Studio. It is queried through its SQL++ query service, so it appears in the connection picker alongside the relational agents. |
Query Studio supports dialect-specific optimizations, query formatting, and explain plan parsing for the following 17 database engines:
| Database dialect | Query Studio identifier | Features supported |
|---|---|---|
Amazon Redshift |
|
Autocomplete, Text Explain |
CockroachDB |
|
Autocomplete, Explain Plan tree, Read-only isolation |
Couchbase (SQL++) |
|
Autocomplete, Read-only session (Skipped transaction locks) |
Google BigQuery |
|
Autocomplete, Read-only session (Skipped transaction locks) |
IBM Db2 LUW |
|
Autocomplete, Text Explain, Read-only isolation |
Informix |
|
Autocomplete, Read-only isolation |
MariaDB |
|
Autocomplete, DDL viewer, Text Explain, Read-only session |
MS SQL Server |
|
Autocomplete, XML Explain Plan tree, DDL viewer, Read-only isolation |
MySQL |
|
Autocomplete, DDL viewer, Text Explain, |
Oracle Database |
|
Autocomplete, Text Explain, DDL generation, Read-only session |
PostgreSQL |
|
Autocomplete, DDL viewer, JSON Explain Plan tree, |
SAP HANA |
|
Autocomplete, Read-only session |
SingleStore |
|
Autocomplete, Read-only isolation |
Snowflake |
|
Autocomplete, Read-only session, Cost prevention banner |
Sybase ASE |
|
Autocomplete, Read-only isolation |
Vertica |
|
Autocomplete, Read-only session |
YugabyteDB |
|
Autocomplete, Explain Plan tree |
Operational procedures
Executing a query
-
Navigate to Query Studio from the Control Plane left sidebar.
-
In the top bar, select your Pipeline and the associated Agent connection.
-
Write your SQL statement in the active editor tab. Autocomplete will recommend keywords, tables, and column names as you type.
-
(Optional) Highlight a specific statement if you have multiple queries written in the same tab. Query Studio will only execute the highlighted block.
-
Click Run or press
Ctrl/Cmd + Enter. -
If your query contains named (e.g.,
:id) or positional (e.g.,?) parameters, a modal will prompt you to enter values. -
Once executed, the Results tab will populate. The status bar will show the row count and execution duration in milliseconds.
Reviewing execution plans
To analyze query performance and ensure indexes are leveraged correctly:
-
Write your query in the editor.
-
Switch to the Explain tab in the result pane.
-
Click Run or use the shortcut. Query Studio runs a dialect-specific
EXPLAINrequest behind the scenes. -
The plan will render as a visual, nested tree block showing node costs, estimated rows, and scan types (or as the database’s native raw output format, such as MS SQL XML or BigQuery JSON).
Analyzing result statistics
The Stats tab calculates statistics on the client side for the active result set:
-
Numeric columns: Displays Min, Max, Mean, Null Count, Null Percentage, and Total Row Count.
-
String columns: Displays Min Length, Max Length, Unique Value Count (calculated on result sets up to 1,000 rows), Null Count, Null Percentage, and Total Row Count.
-
Temporal/Other columns: Displays Null Count, Null Percentage, and Total Row Count.
Exporting and copying data
The toolbar Export menu provides:
-
Export CSV: Downloads the returned result set as a
.csvfile. -
Export XLSX: Downloads the returned result set as an
.xlsxworkbook. -
Export JSON: Downloads the returned result set as a
.jsonfile. -
Copy as CSV / JSON: Copies the rows directly to your system clipboard.
-
Copy as INSERT: Generates standard SQL
INSERTstatements from the result set. When clicked, a modal prompts you to define the target table name, then places the complete insert script onto your clipboard. -
Copy as Markdown, Copy as HTML, and Copy as XML: Copy the current result in those formats (2.2.11.1 UI).
Browsing a table
2.2.11.1 UI. Click a table in the schema tree (or start from a SELECT * FROM schema.table browse) to open a dialect-quoted SELECT *. The SQL stays visible and editable in the editor, and Query Studio auto-executes it with SafetyGate forced read-only (forceReadOnly). Entering browse mode enables column filters.
Filtering browse results
2.2.11.1 UI. In browse mode, opening a column filter picker loads distinct values from Core Hub. The Hub request names the read-only result scope as scopeSql (the UI builds this from the browse SQL without that column’s own filter), the column to inspect, optional execute parameters when the statement uses them, sampleLimit (UI default and cap 5,000; Hub clamps to that maximum), limit (UI default and cap 200; Hub clamps to that maximum), and includeNull (the picker defaults this to true). The response returns values (which may include nulls), echoes sampleLimit and limit, and sets truncated when more distinct values existed in that bounded sample than were returned. If the Hub call fails (for example while rolling out the matching Hub build), the picker falls back to values present on the current result page. Each active filter appears as a dismissible chip labeled {column}: {value} or {column}: NULL. Changing filters rewrites the browse SQL and re-runs it read-only. Filter chips inline their literals into that rewritten scopeSql; they are not added as bound parameters unless the original statement already used parameters. The search placeholder remains Filter results.
Viewing a cell value
2.2.11.1 UI. View value always opens the read-only modal Value viewer — {columnName}. JSON is pretty-printed; nulls display as NULL. This viewer is separate from cell editing. On a non-editable cell, a double-click also opens the value viewer.
Record view
2.2.11.1 UI. On the results toolbar, Record view opens the modal Record {n} of {total} with Previous and Next. Navigation stays within the current result page only.
Session feed
2.2.11.1 UI. The Session feed result tab is a client-side list of statements run in this Query Studio session. The heading is Statements run in this Query Studio session. Use Clear to empty the list. Before anything has run, the empty state is Run a statement to see it here. Each item shows the SQL, status (Running, Success, Error, Timed out, or Cancelled), start time, and elapsed milliseconds.
Editing cells in place
Cell editing is available only in Writable mode to authorized MANAGER and SUPER_ADMIN users. Query Studio enables editing only when every result column reports the same non-null schema and table. This limits editing to a single-table SELECT; joins, aggregations, and results without consistent origin metadata remain read-only.
Query Studio also requires primary-key columns from schema discovery. Primary-key cells cannot be edited. On an editable non-primary-key cell in Writable mode, a double-click starts editing (tooltip Double-click to edit). Use Edit value for the same path. Enter or blur saves; Escape cancels. On a non-editable cell, a double-click opens the value viewer.
The writable cell overflow Cell actions menu (2.2.11.1 UI) offers Set NULL, Set DEFAULT, and Save value to file. Confirmations are Set this value to SQL NULL? and Reset this value to the column DEFAULT? An empty string remains an explicit value; SQL NULL is a separate action.
The 2.2.11.1 Hub cell-update API defines valueMode as VALUE, NULL, or DEFAULT. VALUE writes the supplied value, NULL writes SQL NULL, and DEFAULT asks the database to apply the column default. The operator-facing UI uses the Cell actions labels above; those actions map to this Hub valueMode contract.
Importing data
Select Import data on the toolbar to open Import CSV / XLSX into table:
-
Select the target Schema and Table.
-
Select Choose file and provide a
.csv,.xlsx, or.xlsfile. -
Start the import.
The first row must contain column names that match columns in the target table. When the import completes, Query Studio reports the inserted row count and batch count, and displays up to 50 row errors.
Manual transactions
Manual transactions are available only in Writable mode. When the selected agent supports them, use Begin transaction, Commit, and Rollback on the toolbar. A manual transaction keeps a dedicated session connection so all statements run in the same database transaction until it is committed or rolled back.
Core Hub advertises this capability with supportsManualTransactions. The UI defaults target agents to supported and source agents to unsupported unless Core Hub reports otherwise. Query Studio blocks enabling Read-only while a manual transaction is active and prompts you to commit or roll back first.
MCP tools and toolsets
When Dev Mode is enabled, Query Studio shows a mode switch with SQL-capable agents and MCP-capable agents. This workbench is part of Query Studio; it is not AI Studio or the AI-agent settings area.
In MCP-capable agents mode:
-
Select an MCP-capable agent.
-
Choose a tool from the Prebuilt or Custom list.
-
Complete the generated parameter form and select Run tool.
-
Review the response in the result pane.
You can create, edit, and delete custom tools. You can also define toolsets with a name, an optional description, and the selected tool names.
For the server exposed to external MCP clients and its authorization model, see Core Hub MCP server.
Saving queries
To store queries for future use:
-
Click Save query (floppy disk icon) on the toolbar or press
Ctrl/Cmd + S. -
Provide a Name and Description.
-
Select the visibility scope:
-
Personal: Only visible to you.
-
Team/Workspace: Shared with all users authorized on the current pipeline.
-
-
Add relevant tags to categorize the query.
-
Click Save. Saved queries can be accessed anytime from the Saved Queries sub-page (
/query-studio/saved).
Scheduling a query with Chronos
From Scheduler, choose the Query Studio action on a schedule, a chained event, a platform event, or a webhook-triggered event. Pick a pipeline, then a saved query (search by name) or Use a custom query. Chronos stores a SQL snapshot; when the job fires it prefers the live saved query from Core Hub and executes through the same Query Studio endpoint as the workbench (120 second timeout). Groups and entities do not apply. Write statements need I acknowledge this query can modify data.
See Query Studio actions for the Control Plane fields, fire-time SQL resolution, and write safeguards.
Security, permissions, and auditing
Because direct SQL access is a sensitive capability, Gluesync applies strict protection mechanisms on database sessions, user operations, and audits.
Role-based access control (RBAC)
Access to Query Studio is controlled by a robust permission matrix. Permissions are verified both at the UI layer and at the API route layer:
| Role | read-only queries | Writable queries | Manage personal saved queries | Share saved queries | View query audit logs |
|---|---|---|---|---|---|
|
✅ Allowed |
✅ Allowed |
✅ Allowed |
✅ Allowed |
✅ Allowed |
|
✅ Allowed |
✅ Allowed |
✅ Allowed |
✅ Allowed |
❌ Restricted |
|
✅ Allowed |
❌ Restricted |
✅ Allowed |
❌ Restricted |
❌ Restricted |
|
❌ Restricted |
❌ Restricted |
❌ Restricted |
❌ Restricted |
❌ Restricted |
Connection isolation & pool management
-
Dedicated pool: Query Studio creates a separate, isolated read-only HikariCP connection pool (keyed as
qs-[agentId]) distinct from Gluesync’s CDC replication pool. This prevents ad-hoc user queries from starving thread pools or delaying active synchronizations. -
Auto-eviction: Idle connection pools are automatically evicted and closed after 5 minutes of inactivity to release database resources.
-
Connection caps: Pools default to a maximum size of 3 active connections and a minimum of 1 connection.
Destructive query safeguards
-
Read-only toggle: The toolbar contains a Read-only toggle. When active (default), Query Studio starts transactions with database-level read-only configurations (e.g.,
SET TRANSACTION READ ONLY) to intercept and reject statements likeDROP,DELETE, orUPDATE. -
Writable mode requirements: Disabling the Read-only toggle (enabling writable access) is restricted to users with
canRunQueryWritablecapabilities (SUPER_ADMINorMANAGER). Destructive operations executed in this mode will be run directly against the database, triggering a prominent warning notification in the UI.
Query auditing
Every statement executed in Query Studio is logged to the QUERY_STUDIO_AUDIT schema. The database audit records:
-
The authenticated user’s identity (OIDC subject or local email).
-
The targeted agent and pipeline identifiers.
-
A SHA-256 hash of the complete SQL text.
-
A truncated 200-character SQL text preview.
-
Read-only status, execution status (completed, error, cancelled, timeout).
-
Execution timestamps, duration (in milliseconds), and row count.
Audit records are retained for 90 days by default, and can only be queried or viewed by users possessing SUPER_ADMIN privileges.
Working with large datasets
To avoid memory exhaustion (OOM) on both the Gluesync Core Hub JVM and the user’s browser, Query Studio implements several data mitigation policies:
-
Hard row limit: The backend enforces a server-side cap (defaulting to 10,000 rows) for all executed queries. If the database returns more rows than the limit, the server truncates the result set, flags the response as
truncated, and shows a warning in the UI. -
Client-side page size: The result grid defaults to 200 rows, allowing smooth DOM rendering. Users can configure the page size up to 5,000 rows.
-
Virtualized grid: The result data grid is virtualized using
react-window, rendering only the visible viewport. This enables scrolling performance at 60 fps even when displaying large datasets.
Troubleshooting
Tables or schemas are missing from the tree
-
Cause: The database connection parameters might restrict schema access, or schema filters are applied in the agent configuration.
-
Resolution: Verify database user privileges. You can also trigger a manual refresh on the Schema Browser to force a metadata synchronization.
Query fails with a timeout error
-
Cause: The statement is scanning a large unindexed table, or the database is under heavy load. The default Query Studio client timeout is 30 seconds.
-
Resolution: Use the Explain panel to check the query path. Avoid scanning massive tables without selective
WHEREclauses.
Best practices
-
Default to Read-only: Keep writable mode disabled unless performing planned database maintenance or debug corrections.
-
Use parameter binding: Leverage named parameters (
:value) rather than hardcoding constants. This makes query templates reusable and allows saving them for your team. -
Optimize Snowflake / BigQuery scans: Be cautious when querying metered analytical data warehouses. Running broad
SELECT *scans can incur significant infrastructure query costs. Use narrowWHEREfilters and strictLIMITclauses. -
Validate mappings locally first: When verifying pipeline sync values, start with a small, specific key lookup before querying general table counts.
scheduler-module JWT, not this ordinary external-module Query Studio role.