Alert thresholds in Control Plane
The Alert thresholds page in the Control Plane lets you tune the anomaly detectors that decide when Gluesync fires events. It also shows live health status for every monitored entity and lets you simulate new threshold values against real data.
What alert thresholds control
Alert thresholds determine when the platform considers a condition abnormal enough to generate an alert event. Events then flow to your configured notification channels — email and webhooks.
The available detectors include:
-
Latency threshold — fires when end-to-end replication latency exceeds a static limit
-
Row count drift — fires when source and target row counts diverge beyond a percentage (developer preview)
-
Data flow stall detector — fires when an entity stops emitting batches for longer than the configured stall duration
-
Throughput anomaly detector — uses EWMA control charts to detect statistically significant throughput drops
-
Latency pattern detector — detects sudden spikes and sustained latency elevations against a rolling baseline
-
Seasonal throughput detector — same-time-of-day pattern analysis for throughput (disabled by default)
-
Alert cooldown — minimum quiet period between repeated alerts of the same type for the same entity, preventing alert storms
These values are global defaults. A pipeline can use Smart Alerts to override its threshold, sensitivity, cooldown, and enabled anomaly types without changing other pipelines.
Where to configure alert thresholds
Open the Control Plane and navigate to Settings → Alert thresholds.
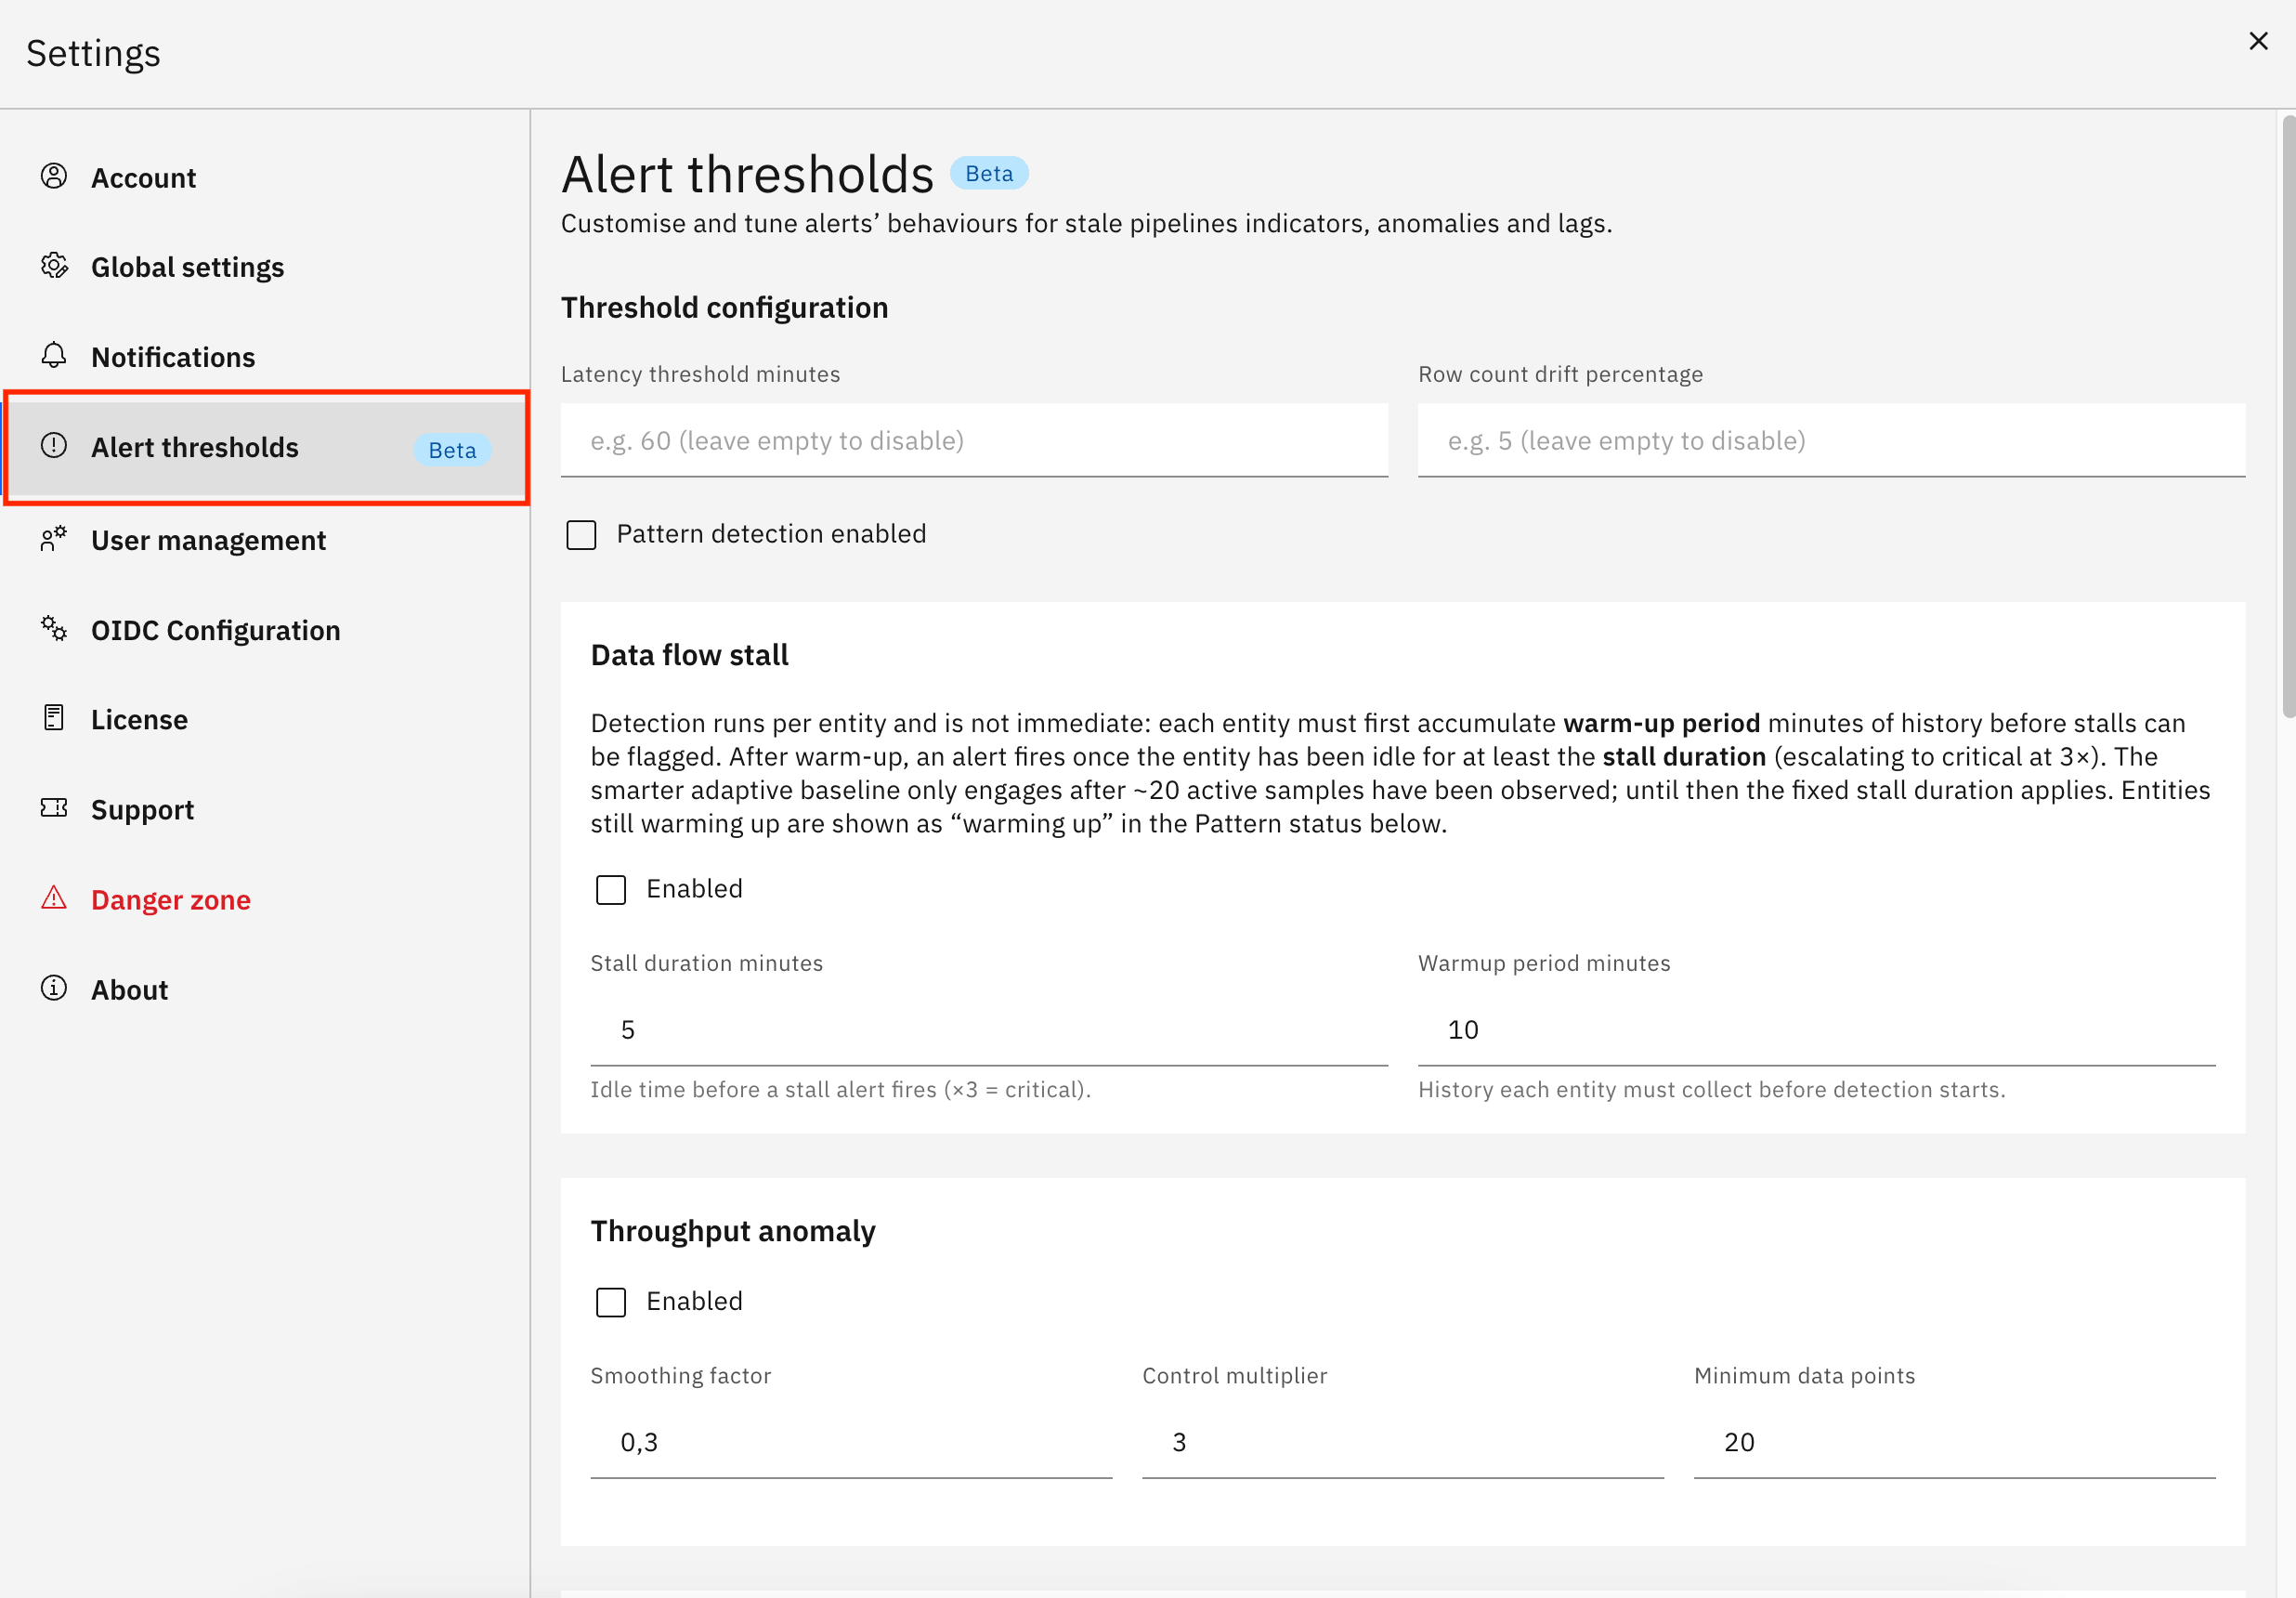
From this screen you can:
-
Adjust each detector — toggle detectors on or off, and tune numeric parameters such as stall duration, smoothing factor, and multipliers
-
Set the alert cooldown — configure the countdown between repeated alerts
-
View pattern status — see the current health, latency, and throughput of every monitored entity at a glance
-
Run a simulation — test new threshold values against live data without actually dispatching notifications; the UI shows the events that would have been generated
Configure Smart Alerts for a pipeline
-
Open the pipeline in the Control Plane.
-
Open Smart Alerts.
-
Enable Smart Alerts and select the anomaly types to monitor.
-
Override sensitivity, thresholds, or cooldown where the pipeline’s traffic pattern requires different tuning.
-
If the pipeline contains entities, select the entities to monitor. This selection acts as an allowlist.
-
Save the pipeline.
Use pipeline overrides for traffic patterns that do not fit the global baseline. A high-volume critical pipeline can use higher sensitivity, while a pipeline that receives only a few rows per day can exclude stall or latency monitoring to avoid expected idle periods producing noise.
Click Reset to inherit to remove a pipeline override and use the current global value again.
Smart Alerts threshold hits appear as WARNING on the affected pipeline or entity. WARNING is non-blocking and indicates an anomaly that needs attention. ERROR indicates a failure that blocks or breaks the operation.
Anomaly detection depends on representative traffic history. Review the warnings and tune each pipeline instead of treating every detection as a confirmed failure.
Related documentation
For a detailed explanation of every detector, its parameters, default values, and pipeline-level configuration snippets, see Alert thresholds.
To understand how threshold events are delivered, see Alerting overview.